Cruel Fuel World or Cruel World Fuel?
Another nice flash animation (sorry rss readers…) on how to view the world. Notwithstanding having fuel prices calculated based on an arbitrary set of conditions like taxes, tariffs, subsidies, and refining/transportation cost is kinda moot, because none of the above applies equally to every citizen in the country, but overall, this gives a general regional picture of who’s being forced to stop driving most but all these forces.
I think our generation go down the history textbooks as one of the most fortunate times because we get to vroom vroom …
[kml_flashembed movie=”http://www.portfolio.com/images/site/editorial/Flash/interactive-feature/2008/08/fuel-world/fuel-world.swf” height=”399″ width=”582″ /]
Click here to launch a new window for a bigger size.
Source: Portfolio.
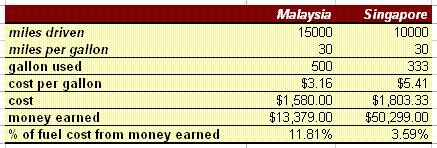
Singapore vs Malaysia is $5.41 vs $3.16 (cost per gallon, everything in USD) still a far cry from Hong Kong’s $8.05, but make a sweeping assumption of equal GDP per capita (SG $50,299 vs MY $13,379) and the fact that Malaysians drives 50% more (assume MY 15,000miles / year but SG coz got ERP and small so only 10,000miles / year), and all cars are as efficient (say 30 miles/gallon), then we can work out that:

That indeed, fuel cost is a smaller consideration on the island. Do you agree with such an analysis?
