Building the Optimal Global Footprint on the Causeway
This is my own interpretation of a report available online by A.T.Kearney, entitled, Building the Optimal Global Footprint. Good stuff, no idea why they give these out free.
Aptly renamed from Offshore Location Attractiveness Index to Global Services Location Index to reflect the global nature of today’s businesses, the GSLI continues to give a thumbs up for China and India, even as trends are pointing the other direction with rising labour cost and other risks (Free Tibet anyone?). Fortunately, the rest of the top 5 to 6 are dominated by South East Asian countries. Here’s the list directly from the site:

One can easily read too much into these index. Here’s quick look at what each piece of the index is trying to address:

I’ve done a small mini analysis myself for a better understanding of how each factor in the metric affects the index. Specifically, labour cost continues to play a large part, followed by country risk inherent in the political and economic climate and regulatory regimes. A good amount of the index is dedicated to infrastructure (be is transport, communications, power, what not) while the rest are the finer parts (quality) of the workforce and environment.
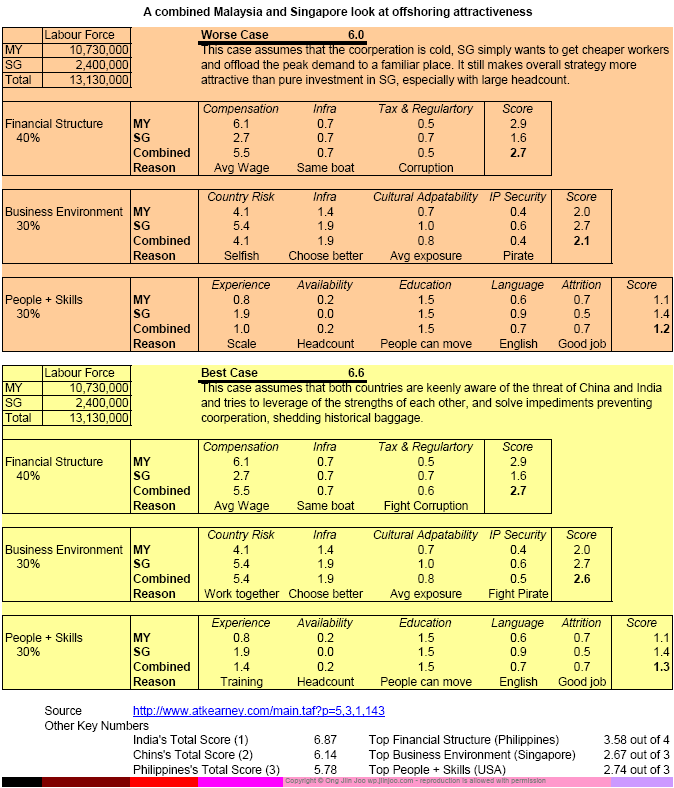
In fact I’ve done a quick hypothesis and check it against their model at a superficial level. Suppose if Malaysia (which ranks 3rd currently after India and China) and Singapore (which I’m temporarily stuck in) come together to promote both countries as a common place to “offshore” to or to setup regional HQ (have you seen EDB and MIDA working together?) how would one make a combined index?
Ok let me further elaborate my totally unscientific analysis (consulting companies beware). There are 2 cases. One is a “ok lar let’s work together to get this big fish to come here”. The other is a “oh no if we don’t work together we’re screwed”. For both cases, certain metrics won’t change, such as compensation (labour force weighted), financial investment on infrastructure, level of education and linguistic capabilities and availability of manpower for hire (there’s just that many people in total). Also, companies will always gravitate towards better infrastructure (if the data center in Malaysia no cable, then setup in Singapore; if the office in Shenton Way is $12 psf, then just setup in Kuala Lumpur) and attrition is going to be maximized (wah more jobs there).
However, the two governments can choose to make a difference in tax and regulatory regimes (if you setup half half, i tax you less; or, if you hire my people in the other country, I work out special plan), country risk (ok don’t fight, solve water issue, sand issue etc.), and cooperation on intellectual property security (BSA’s $20,000 prize for anyone who catch pirated software in Malaysia also!). In addition, more cross training and pollination of business ideas and culture can further boost the exposure of the workforce towards international demand, and ways to tackle them effectively.
In cases where both countries suffer from the same disadvantage compared to China and India (very obviously labour cost, but not so obvious the labour force availability and quality of training and management), there is very little that can be done. But in cases where today it’s seen as a complimentary effect (a lot of which are brought up as benefits to the creation of the Iskandar Development Region) there is a lot more work that can be done to established connected infrastructure (where’s that MRT to JB and free IDD calls?), common understanding on political issues and implications, strategic co-investment in a transparent manner (with as much publicity implications as the financial implications of these long term funds), and real action items for creating a seamless environment to allow for businesses to selectively leverage the strengths of both countries.
So in the best case, we beat China (6.6 vs. 6.14), and close in on India (6.87). In the worst case, we’re still probably 3rd fictitiously (6.0). Bearing in mind that the devil is in the detail and this is but one report, we can take a step back and ask ourselves, how do we keep our ranking, i.e. to boost one factor without sacrificing another and grow at an appropriate rate without sacrificing other social benefits for the people.


Wait wait wait… Malaysia’s Financial Structure is a whole point higher than Singapore because of Labour Compensation, which means that we just get paid less in terms of PPP?
Something like that. You just go around survey some of your friends back home and compare them apple to apple with Singapore. Then go compare a typical CPI (just use your own lifestyle as a comparison).
Typically, I can see a lot of Malaysians enjoying more back home because a huge chunk of burden is taken off by living with the family. Here, I’m paying rent and car loan (haven’t got g/f wife yet) not to mention being my own maid to sustain a decent lifestyle (I’m sure you’re too). Otherwise, PPP is definitely higher. Anecdotally, the same shirt here is $20 in John Little can cost RM70 even Ipoh Jusco, Teh Peng is RM1.50 in KL but $1 or $1.10 in CBD, but a polytechnic grad IT programmer is paid $2200 starting vs RM1500 starting, and the list goes on.